The wonders of metadata

Sarah and I have been geotagging for a while - in fact, around 80% of our 5000+ photos have latitude and longitude metadata. Now that Flickr supports geotagging natively, it's easy to do lots of neat things with the millions of geotagged photos in Flickr. For instance, one can determine that lobster is mostly found on the New England coast, especially in Maine. This data is also exposed through the API, which means that people like me can hammer away at it and ask for the locations of thousands of photos. I decided to see if, by plotting the positions of photos tagged with the names of each of the fifty states, a reasonably accurate map of the United States would emerge. Iterating over the fifty states using flickr.photos.search (specifying a bounding box for the continental US, which has the side effect of only retrieving geotagged photos), I retrieved 55000 points via the API, of which 13343 were unique. Someone else was nice enough to provide four lists of states to satisfy the four-color theorem, and I then just scaled the resulting latitudes and longitudes appropriately and plotted the result using GD:
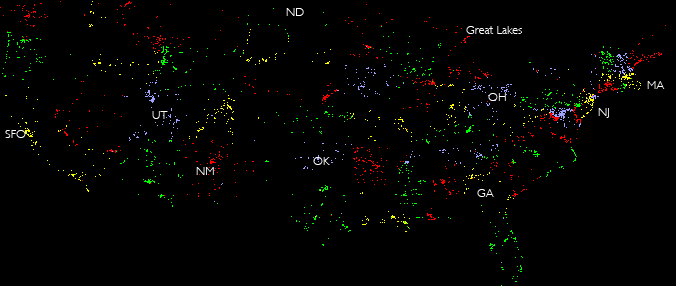
I was actually really surprised it ended up showing the states as well as it did. A lot more people must be tagging with state names than I expected. To be very clear (a lot of people have been confused about this) - the only thing telling a pixel what color it should be is the tag on the photo, not its geographical location. So if a photo was _tagged_ 'Florida', it gets colored green, whether that pixel ends up being plotted at the bottom right corner or somewhere in the middle. The fact that it actually looks like a map of the US means that on the whole, people tagged geographically. There's a few amusing if hard to spot exceptions - some state names that occur as city names in other states, for example.